Technologies used:
- R-Shiny
- SQLite
- ggplot
- dplyr
- clustering and regression
- SPARQL
Description
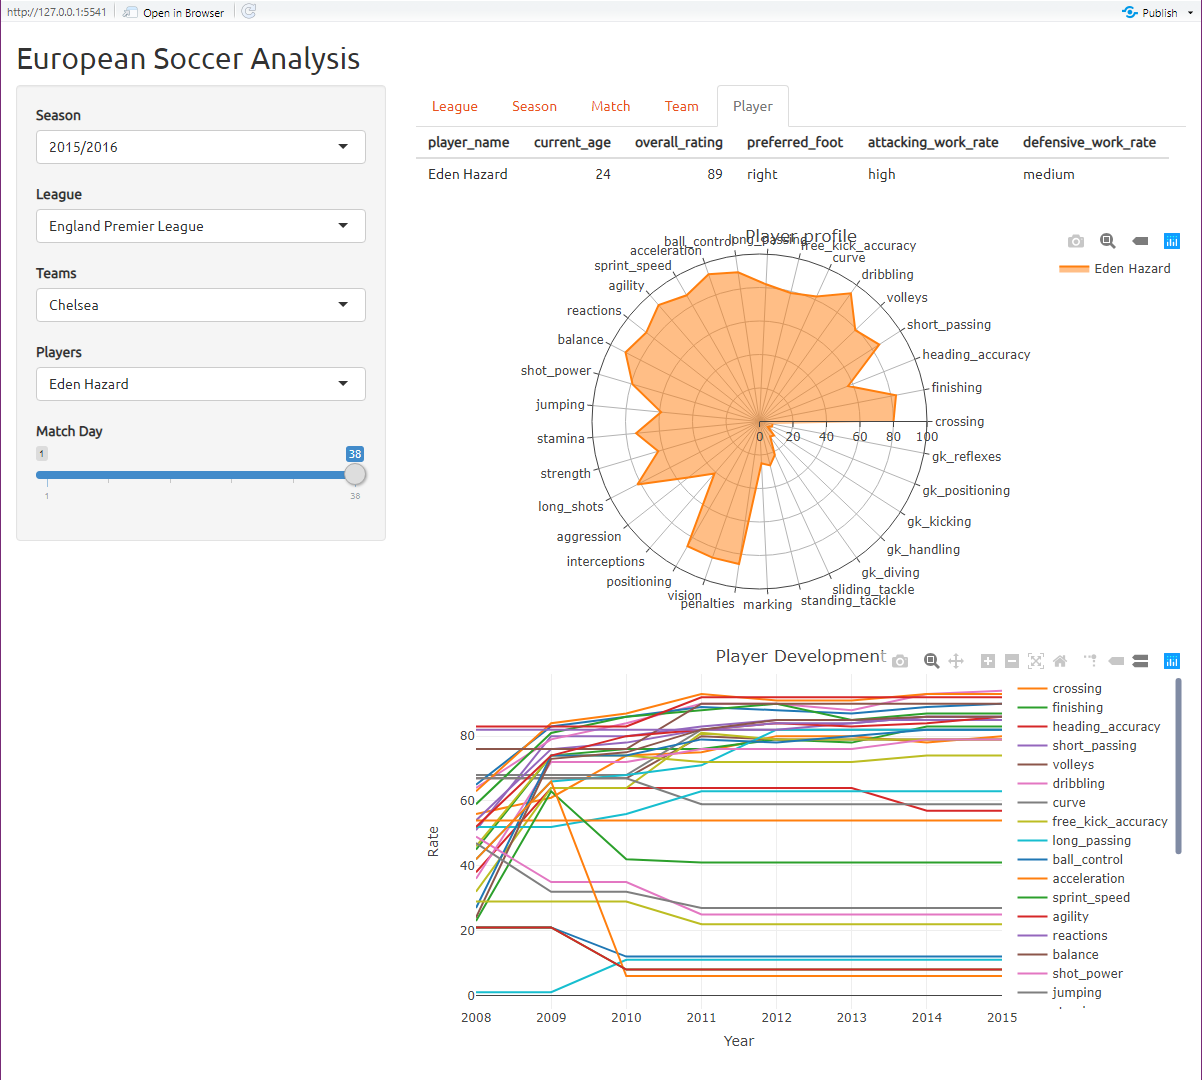
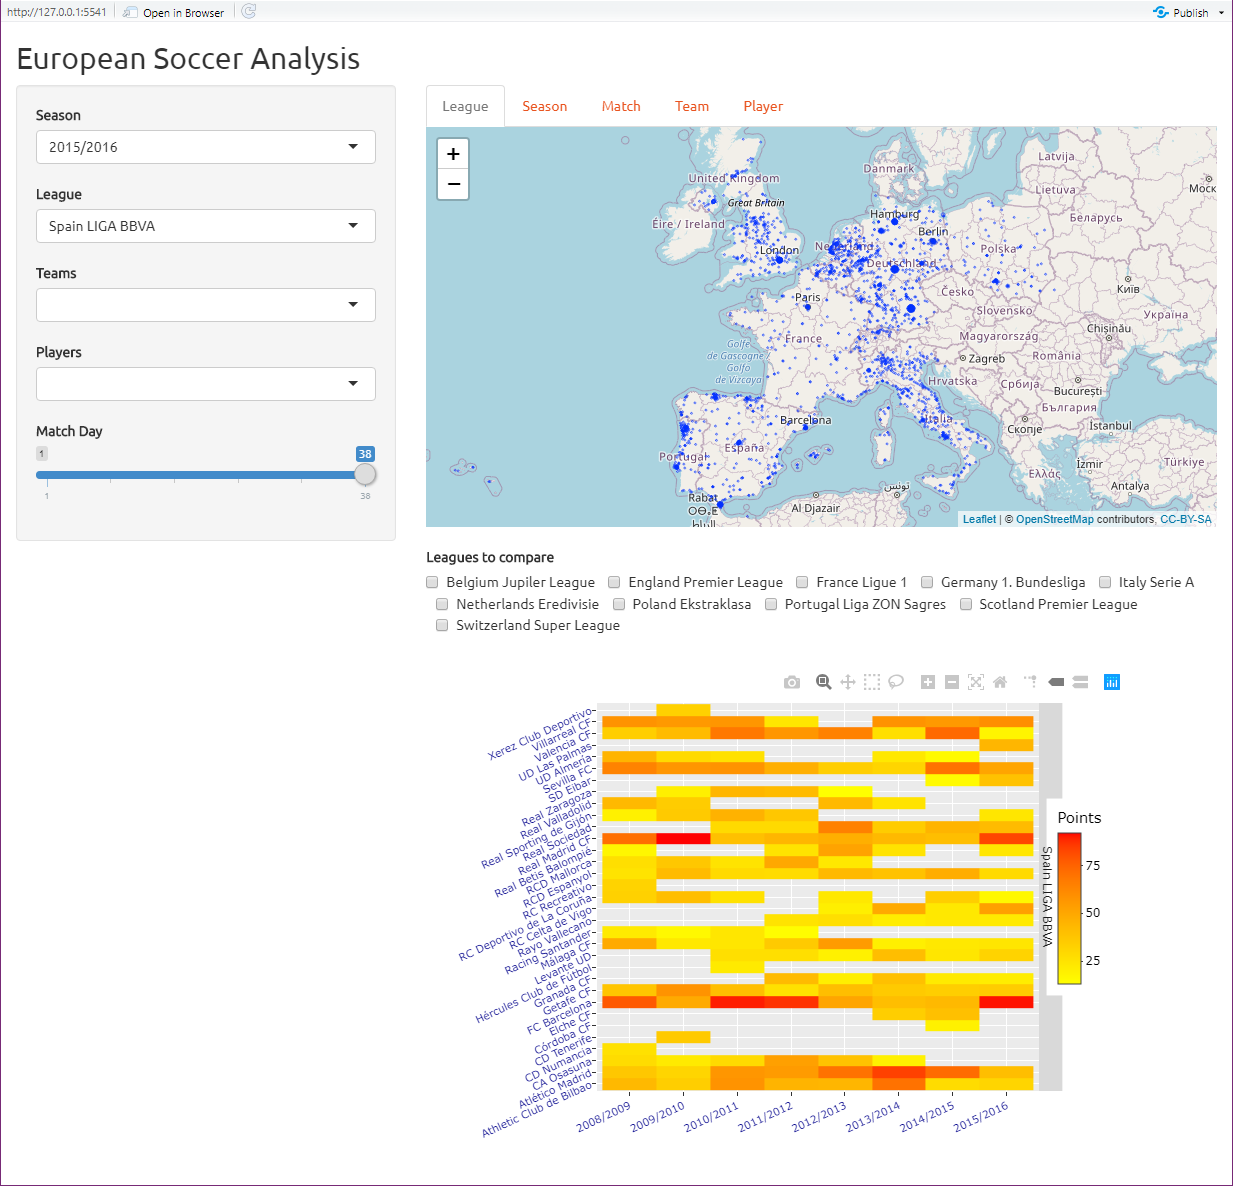
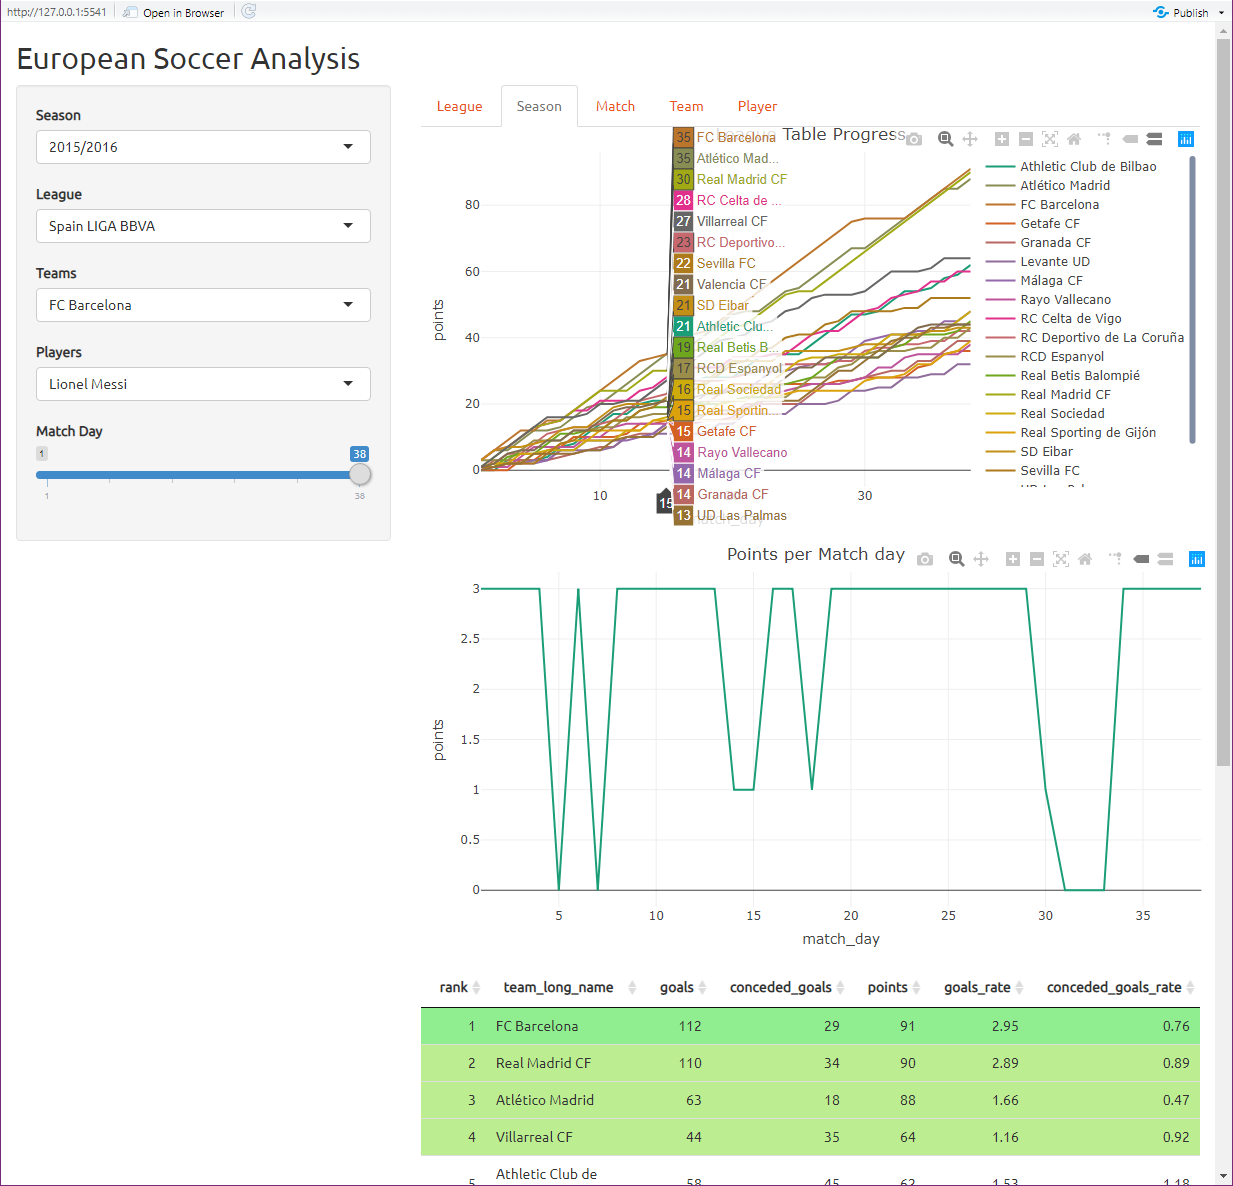
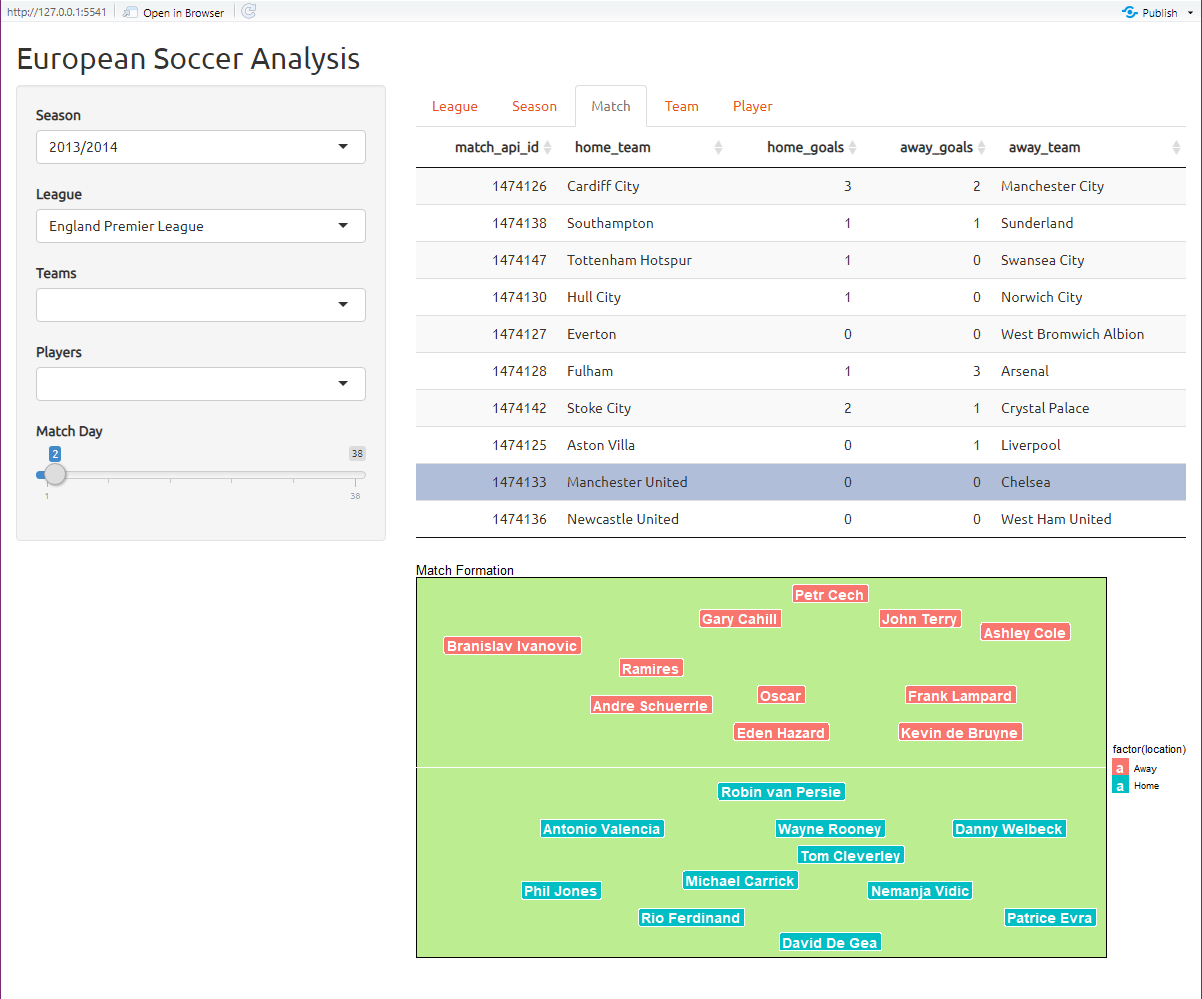
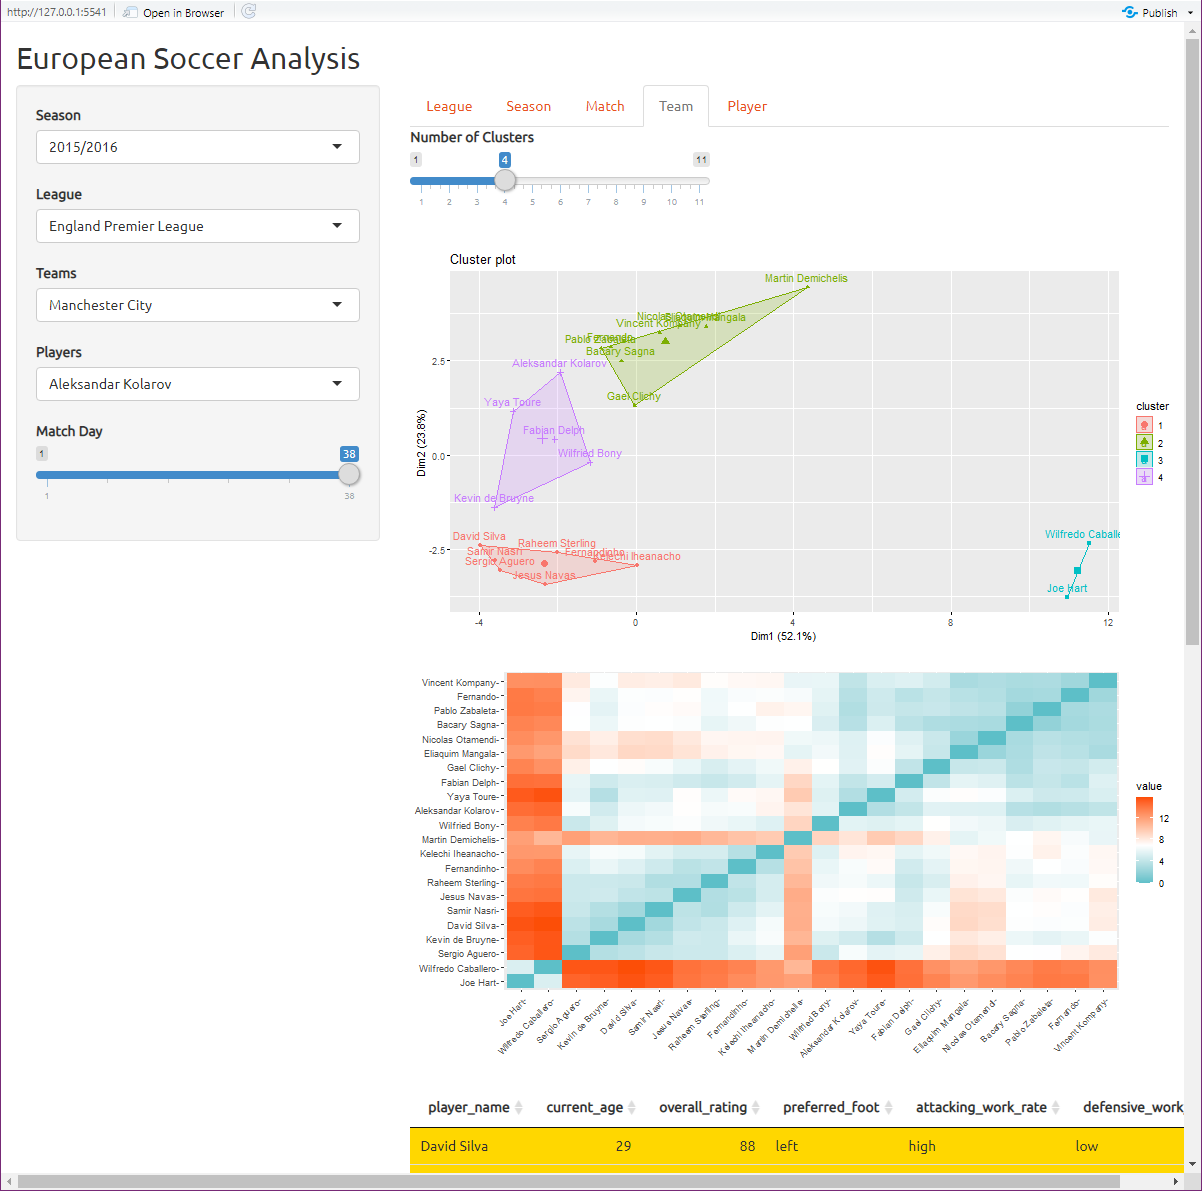
The application is designed for soccer fans with some deep knowledge in this sport and especially for those who play the video game Fifa. The application is responsible to deliver an overview of the data and answer basic questions like which team won its league and who are the best players in each team (according to values determined by Fifa) or where are most football clubs located in Europe/the World. The application goes further and answers more specific questions like how were the results for a specific match day and how does the league table look like at a certain matchday, or how did a player develop himself over the years and how are his stats now. The application provides more specific information like how two teams played a match, with which formation, and which players were on the field at the start of the match, and it shows a comparison of all teams in the league overall seasons, to see the development of points they earned each season. And for people with more interest in specific details about a team they can start a cluster analysis to see which players have similar stats and which players are most similar, this helps the users and especially the Fifa players to make game decisions when they play career mode.
The data selected here is called European Soccer Database and it can be obtained from Kaggle. The data is stored in a SQLite database. For developing the application the programming language R was used. The package Shiny for visualization, dplyr for data manipulation, and ggploy and plotly for plotting graphs, RSQLite for database operations, leaflet for map rendering, and factoextra for multivariate data analyses. SPARQL was used to obtain location data from the open-data platform Wikidata .
The application consists of a sidebar panel that provides general input options to filter the data and the main panel that contains five tab panels. The sidebar panel allows the user to filter the data based on: Season, League, Team, Player, and Match day. These input values are used in each tab panel of the main panel to display the desired results. If the league changed the teams' and players' menus will be reset and if only the season changed the inputs won’t be reset if the team was playing in the league at the selected new season.
| More details available on request. |
